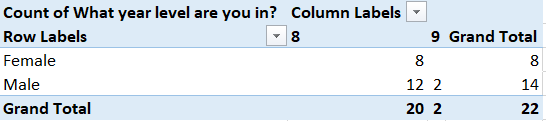
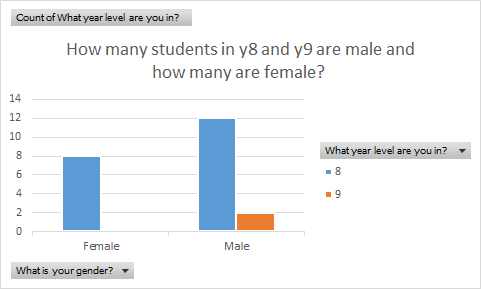
The graph above shows that there were more males that took the survey than females. In one class of year 8’s and 9’s there are 8 year 8 females and 12 year 8 males and 2 year 9 males.
The graph above shows that there were more males that took the survey than females. In one class of year 8’s and 9’s there are 8 year 8 females and 12 year 8 males and 2 year 9 males.
